Reading Your Dashboard
The Swivl Dashboard brings together your most important business metrics in one place, so you can spot what needs attention and take action without switching between modules.
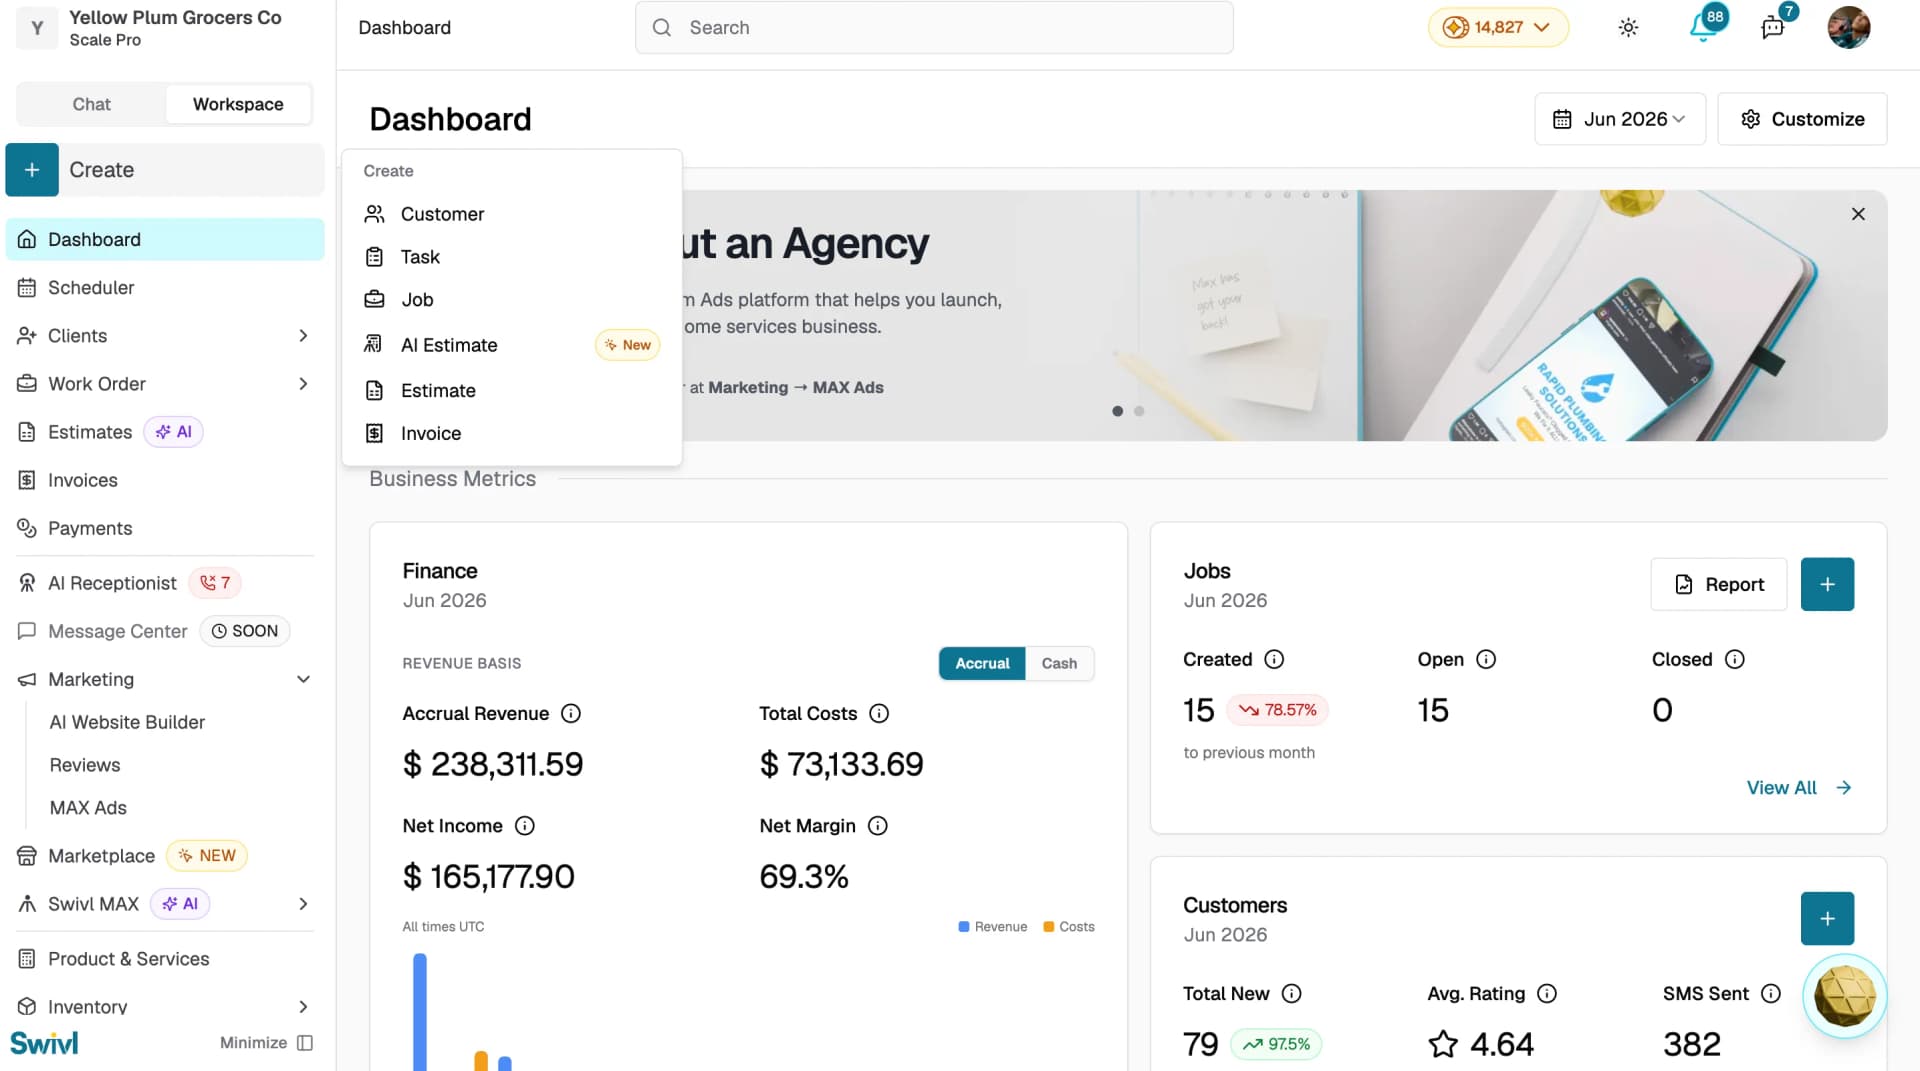
Overview
The Dashboard is the first screen you see when you log into Swivl. It gives you a real-time snapshot of your business including leads, revenue, jobs, customers, invoices, estimates, and field activity all in one place. Use it to check how things are going without digging through individual modules.
Who can access this
- Super Admin: full access to the dashboard and all widgets
- Admin: full access to the dashboard and all widgets
- Lead Technician: no dashboard access
- Technician: no dashboard access
What you'll see on the dashboard
Your dashboard is organised into sections based on your customisation settings. Section labels such as Business Metrics, Leads, Work Order Management, and Setups appear above each group of widgets.
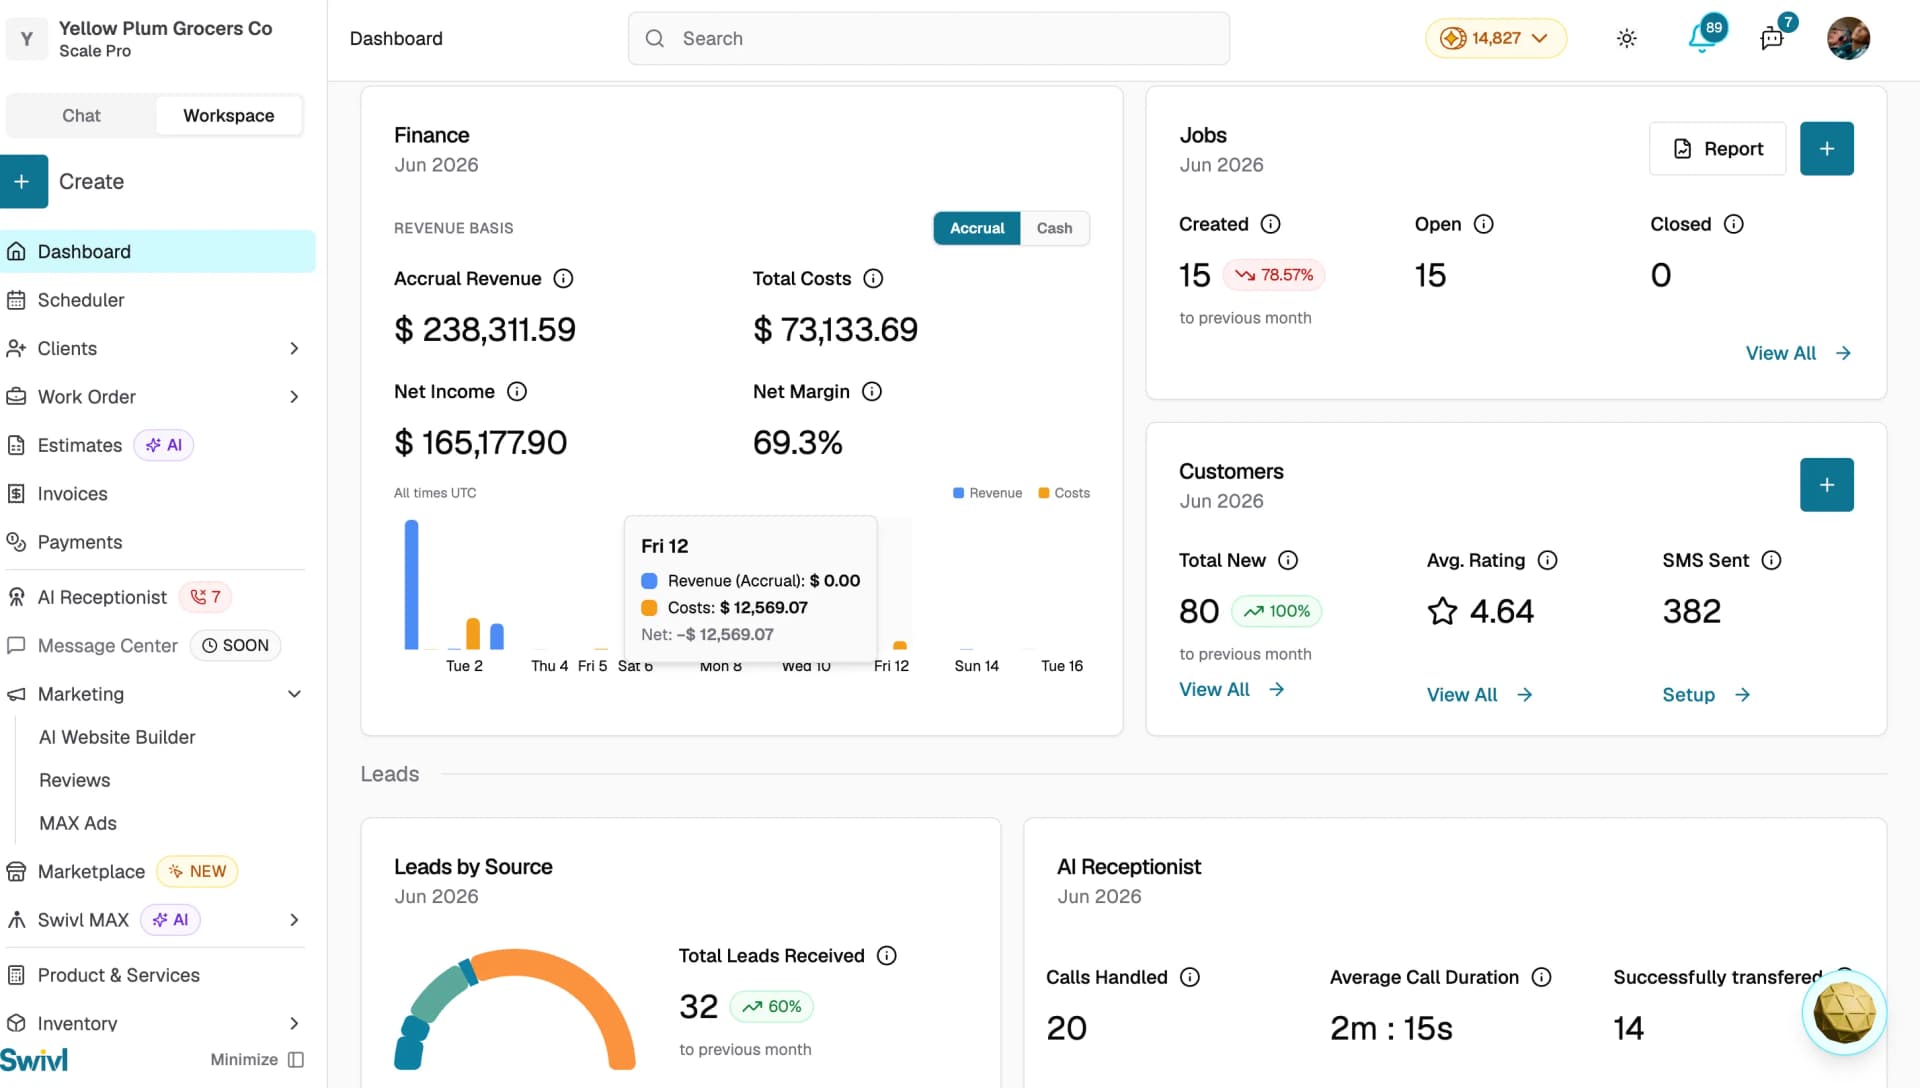
Finance
Displays your Accrual Revenue, Total Costs, Net Income, and Net Margin alongside a revenue trend chart. Toggle between Accrual and Cash basis using the switch at the top of the widget.
Jobs
A quick look at your job activity for the selected period:
- Created: total jobs created
- Open: jobs with unclosed tasks or pending closure
- Closed: completed jobs
Use the Report button to jump to your Jobs Report, View All to see the full jobs list, or the + button to create a new job.
Customers
Shows the number of Total New customers added, your Avg. Rating from customer reviews, and SMS Sent count. Use View All under each metric to see more detail, or the + button to add a new customer directly from the widget.
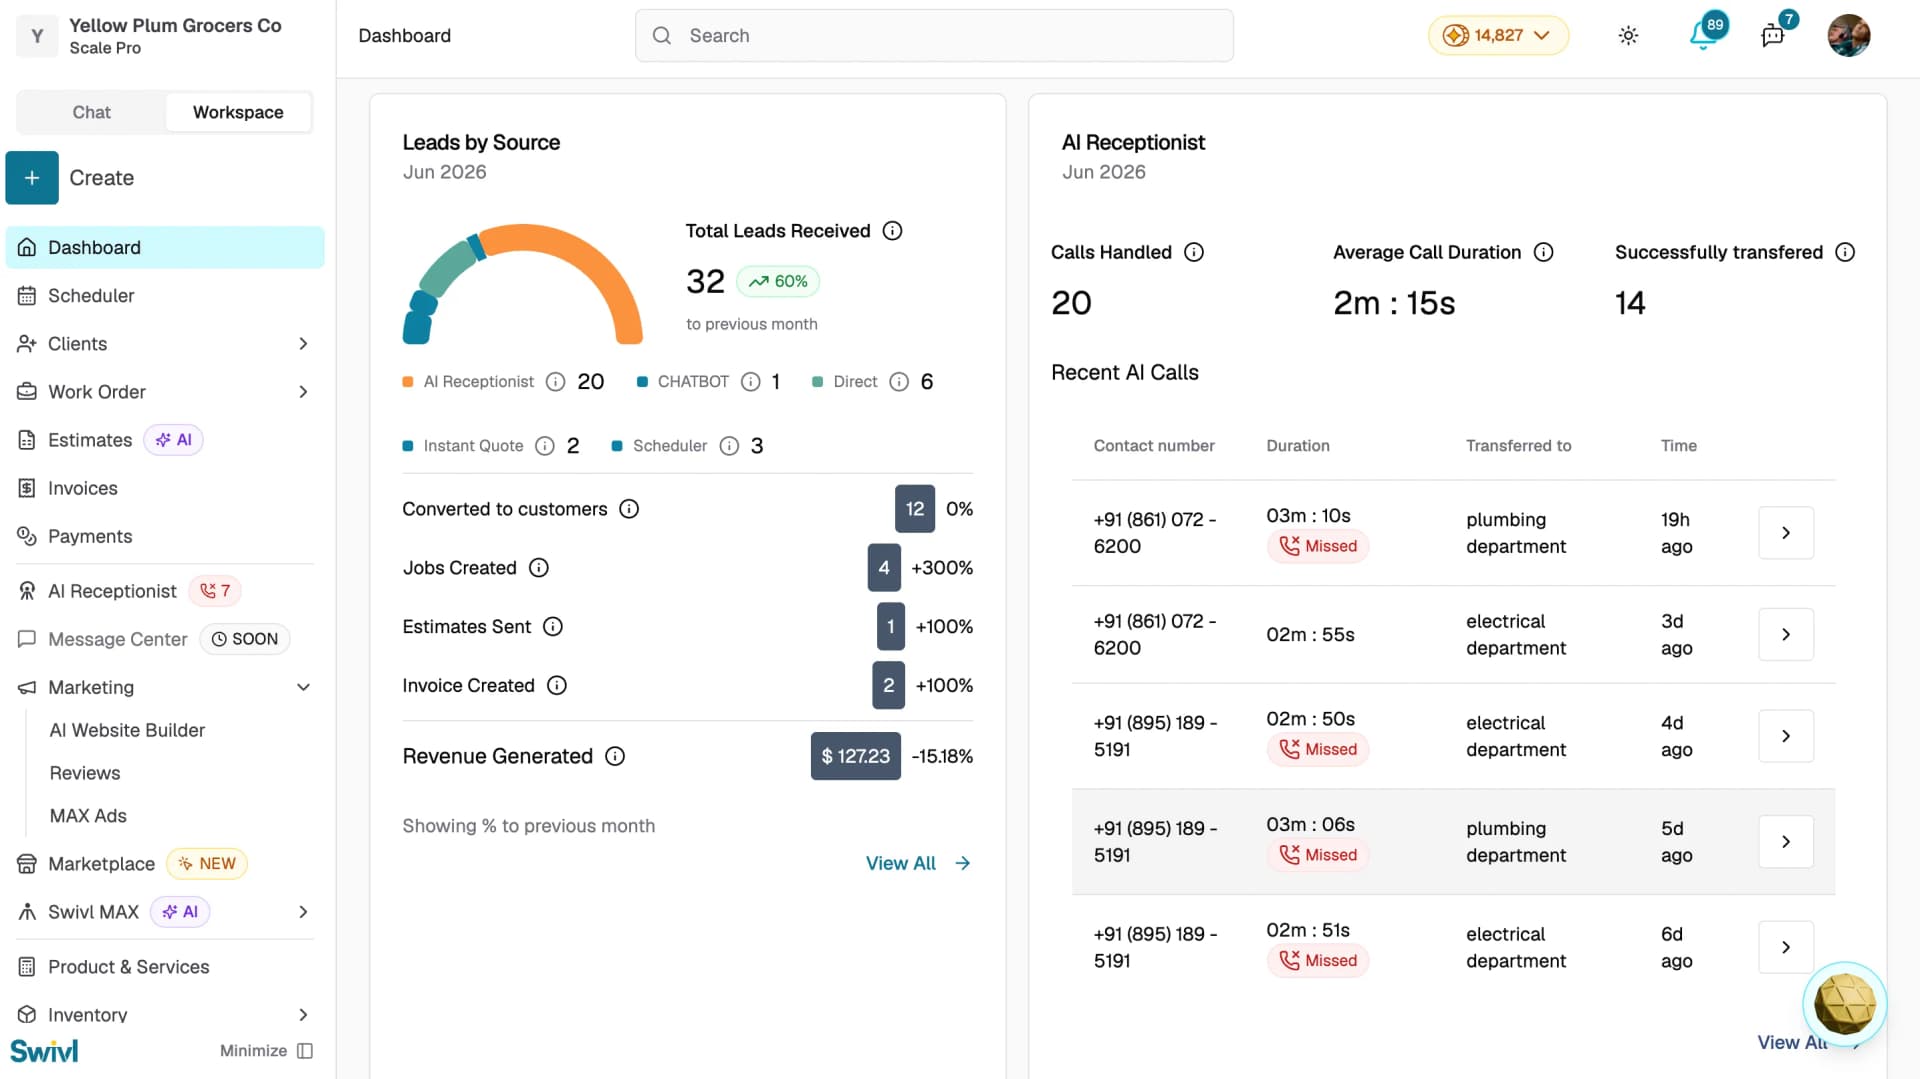
Leads by Source
Shows where your leads come from with a donut chart breaking down sources including AI Receptionist, Chatbot, Direct, Instant Quote, and Scheduler. Key conversion metrics are listed below:
- Total Leads Received
- Converted to Customers
- Jobs Created
- Estimates Sent
- Invoice Created
- Revenue Generated
Each metric includes a percentage change compared to the previous period. Click View All to see the full leads list.
AI Receptionist
If you have the AI Receptionist feature enabled, this widget shows:
- Calls Handled: total calls answered by the AI
- Average Call Duration: average length of each call
- Successfully Transferred: calls successfully routed to your team
A Recent AI Calls table below shows the contact number, duration, transfer destination, and time for each recent call. Click View All to see the full call log.
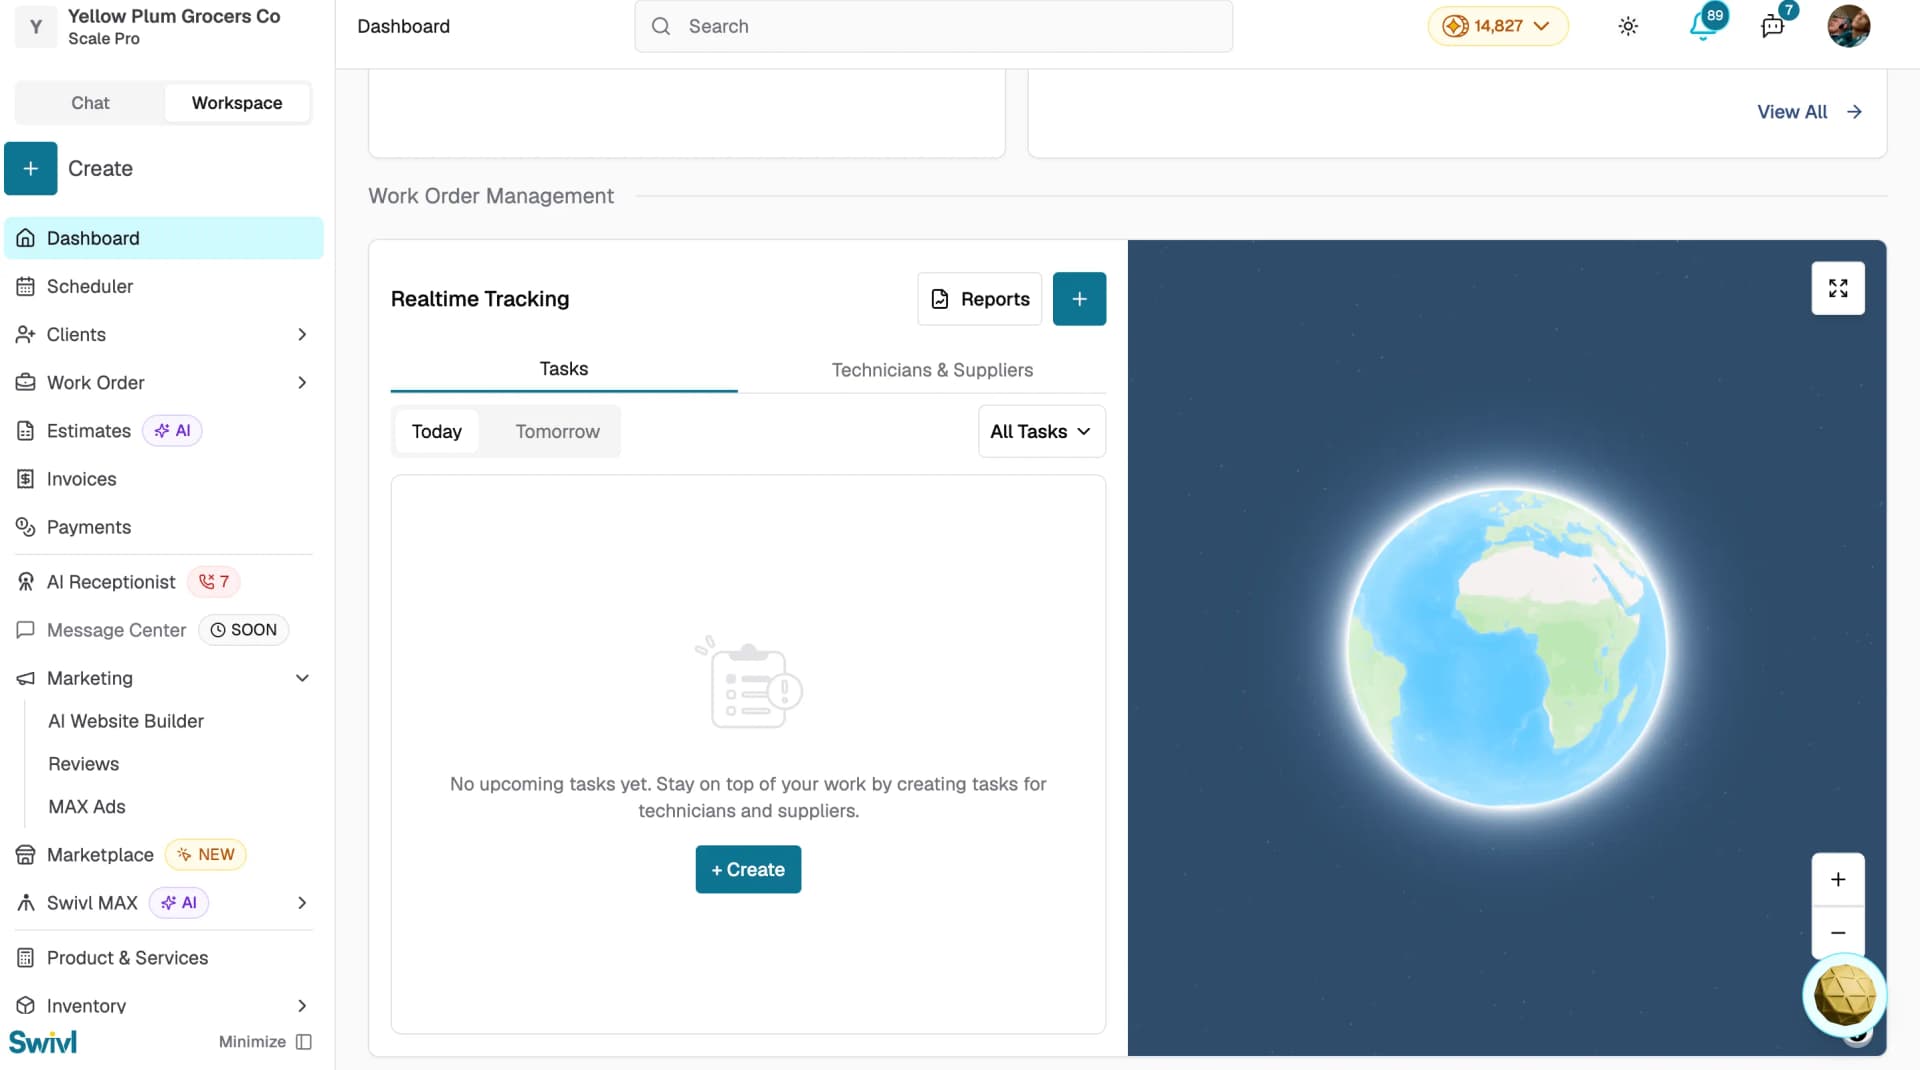
Realtime Tracking
Located in the Work Order Management section, this widget shows a live map alongside two tabs:
- Task: view tasks scheduled for Today or Tomorrow, filtered by All Tasks or a specific category. Click + Create to add a new task.
- Technicians & Suppliers: view field team activity in real time.
Use the Reports button to jump to your GPS report or the + button to create a new task.
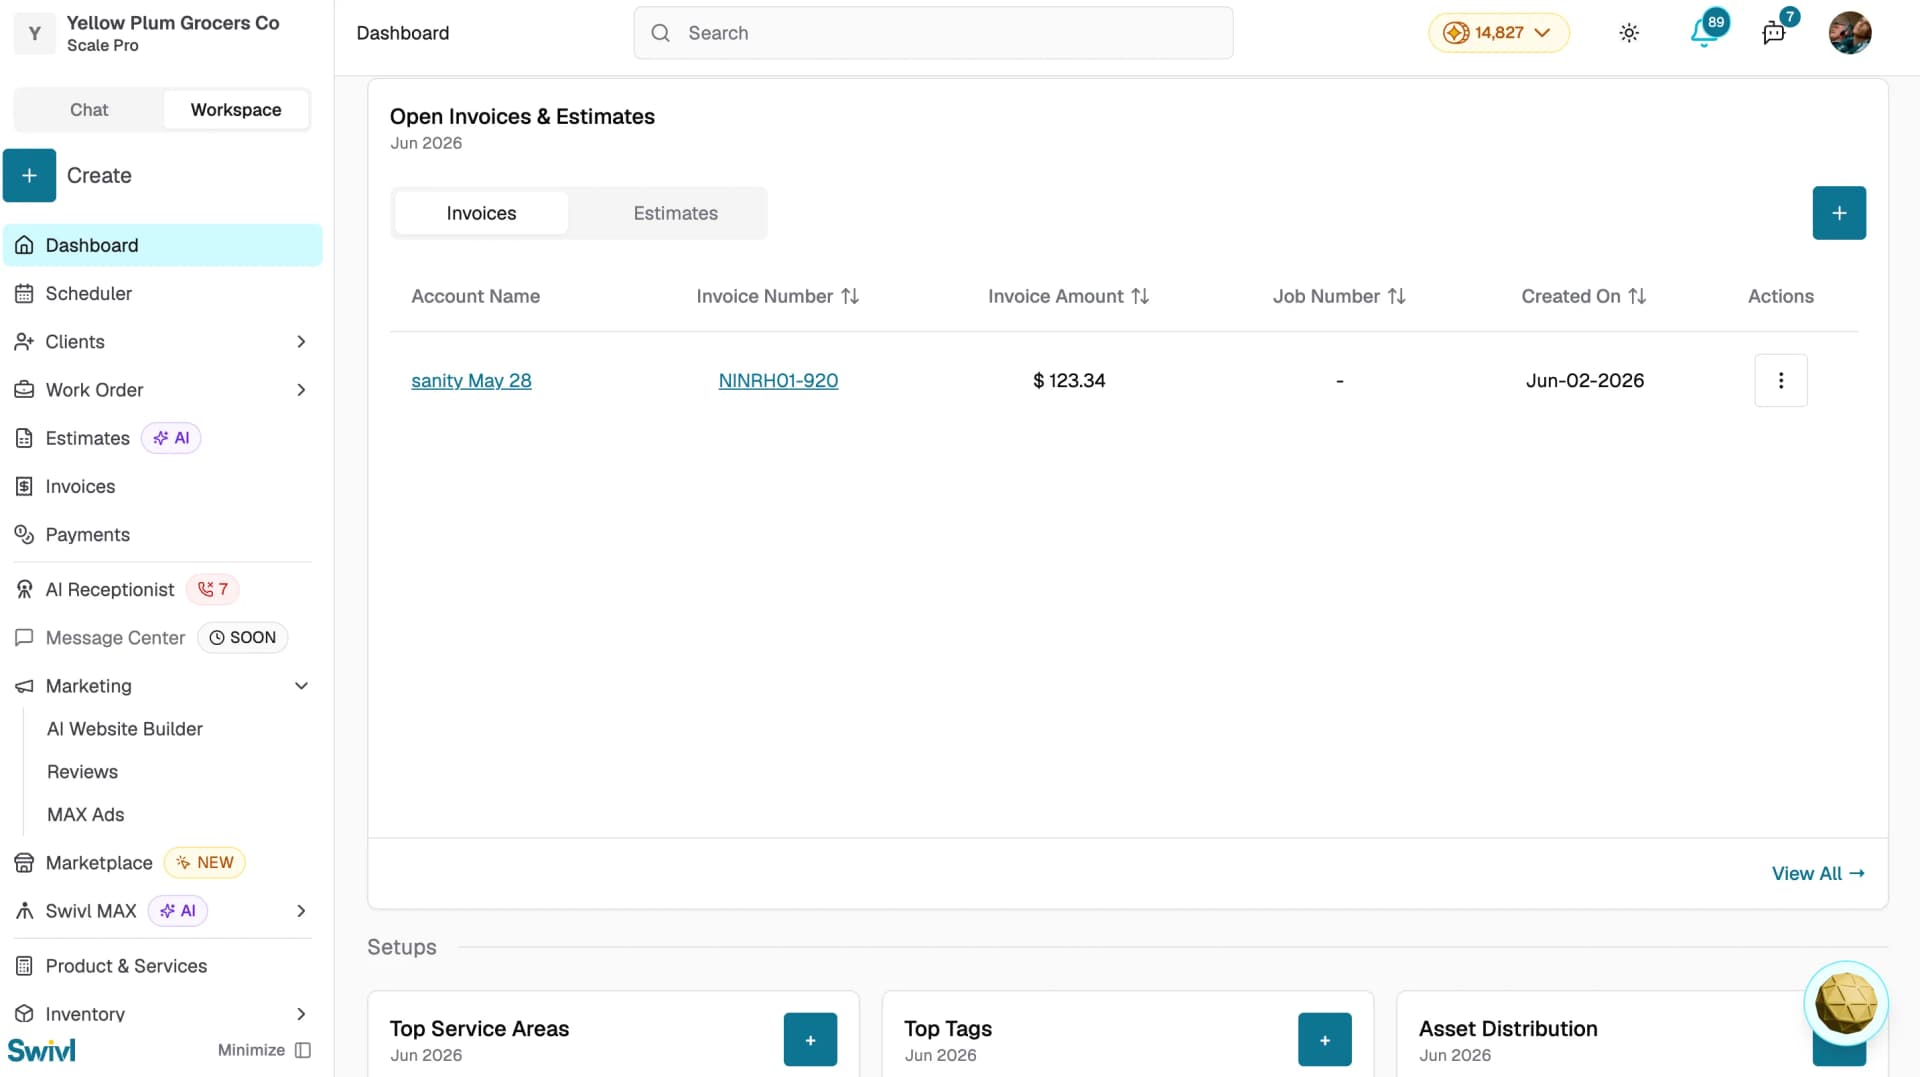
Open Invoices & Estimates
A tabbed table showing your most recent open invoices and estimates. Switch between the Invoices and Estimates tabs to view each. The Invoices tab shows Account Name, Invoice Number, Invoice Amount, Job Number, and Created On. Click View All to see the full list or use the + button to create a new invoice or estimate.
Setups
Three smaller widgets in the Setups section:
- Top Service Areas: a bar chart showing your highest-revenue service zones. Click View All to see the full breakdown.
- Top Tags: a bar chart showing revenue by Service Tag and Account Tag. Click View All to see all tags.
- Asset Distribution: a pie chart showing the split between Vehicles and Tools and Equipment in your asset inventory. Click View All to see the full asset list.
Changing the time period
Use the month selector at the top-right of the Dashboard to change the reporting period. Widgets update automatically to reflect the selected month.
Customising your dashboard
Click Customize at the top-right to show or hide widgets and rearrange your dashboard layout to suit your workflow.
Tips
- Check the percentage change indicators on widgets like Finance, Jobs, and Leads to spot trends at a glance a green arrow means improvement over the previous period.
- Use the View All links on each widget to jump straight to the full list jobs, invoices, leads, and more.
- Click Customize at the top-right to show or hide widgets and tailor the dashboard to your workflow.
- If a widget shows No access, your account permissions may need updating contact your Super Admin.